Effect of Solar Eclipse on 12th August on Solar Power
August 7, 2026
Europe’s next total solar eclipse arrives in the late afternoon on 12 August 2026 — when west-facing arrays still produce strongly. Lessons from eclipses of the last decade — Europe in 2015 and the U.S. West in 2017, 2023, and 2024 — show why operators care about timing, not just peak obscuration. This analysis uses clear-sky modelling and a global obscuration animation to illustrate how the shadow cuts PV output across Europe and eastern North America.
Watch the shadow move
On 12 August 2026 a total solar eclipse tracks across the North Atlantic and into Europe, with near-totality over Spain in the evening and deep partial coverage across the British Isles, France, and much of western Europe. Farther west, eastern Canada and New England see a milder midday partial eclipse.
The interactive map above shows modelled solar obscuration (0–100%) through the event. Darker shades mean a greater fraction of the solar disk is covered — and, under clear skies, a proportional cut to plane-of-array irradiance and PV output.
Eclipses of the last decade
Europe, 20 March 2015 — ENTSO-E
Ahead of the March 2015 eclipse, the ENTSO-E Solar Eclipse Impact Analysis [1] estimated about 89 GW of PV in Continental Europe. Under clear-sky assumptions, system-wide solar infeed could fall by roughly 34 GW near 09:41 UTC, with minute-to-minute gradients steeper than −400 MW/min on the way down and up to +700 MW/min on recovery. Germany alone accounted for about half of the modelled reduction; Italy about one fifth. Beyond the trough depth, planners stressed a possible ~20 GW drop within an hour and nearly 40 GW recovery afterward — ramps two to four times a normal morning.
Critically, the ENTSO-E Solar Eclipse Impact Analysis [1] used the same linear suppression idea we use here: clear-sky PV power scaled by (1 − obscuration). The operational lesson was coordination of reserves across TSOs, careful day-ahead solar forecasts, and readiness for ramp rates far outside a normal spring morning.
What actually happened is documented in the ENTSO-E / SolarPower Europe Solar Eclipse Policy Brief [2] — Europe’s first large-scale eclipse stress test with roughly 90 GW of PV on a weekday morning. Cloudier weather than the clear-sky worst case muted the western impact, but Germany and Italy still saw a strong cut. Aggregated feed-in from reporting TSOs fell from about 22 GW near the start to roughly 14 GW at maximum obscuration, then climbed to about 35 GW by midday — a recovery of order +21 GW in about 90 minutes. Continental European frequency stayed inside the ±50 mHz standard band (maximum absolute deviation 48 mHz); no TSO needed emergency help from neighbours.
That outcome was not luck. TSOs spent months preparing: roughly double normal reserves in Germany, strategic pumped storage, tighter ACE control, quarter-hour marketing of forecast PV in Germany, preventive day-ahead PV reductions in Italy (~4.4 GW), reduced HVDC transfer capacities between synchronous areas, and a continuous pan-European control-room teleconference through the event. Extra reserve procurement alone cost millions of euros (about €3.6 M in Germany). The ENTSO-E / SolarPower Europe Solar Eclipse Policy Brief [2] emphasised observability of distributed PV in real time, controllability (including planned curtailment), liquid intra-hour markets, and regional security coordination — not only more spinning reserve.
Part 2 of the ENTSO-E / SolarPower Europe Solar Eclipse Policy Brief [2] already looked ahead to 2021 and 2026. With SolarPower Europe then projecting PV rising toward roughly 170 GW by 2021 and 250 GW by 2026 (about three times the 2015 fleet), ENTSO-E and SolarPower Europe argued that eclipse-proofing would need network codes, regional coordination centres, demand-side flexibility, PV providing system services, and a stronger TSO–DSO interface — because most solar sits on distribution grids that transmission operators must still see and manage.
United States, 2017–2024 — NREL / EIA and CAISO
For the 21 August 2017 total eclipse — totality over the Pacific Northwest, a deep partial over California (~62–76% obscuration) — the CAISO August 2017 Solar Eclipse Report [3] was the balancing area’s first eclipse stress test at scale: about 10 GW of grid-connected solar and 5.8 GW of rooftop PV. Clear-sky grid-scale output was expected to fall from roughly 7.3 GW to 3.1 GW (~−70 MW/min) and rebound at nearly +100 MW/min, with Europe’s 2015 experience cited as the template for planning. Then came the 14 October 2023 annular eclipse, whose path of annularity crossed the West. The CAISO October 2023 Solar Eclipse Technical Bulletin [4] expected a deeper western hit with grid-scale and rooftop fleets grown to about 16.5 GW and 14.4 GW (California obscuration ~68–89%): grid-scale drops of order 9.4 GW into the trough and ~10.8 GW on the return, with net-load ramps averaging about +122 and −190 MW/min. Accuracy of day-ahead eclipse-aware solar forecasts again limited real-time re-dispatch — the same lesson that had worked in 2017.
By April 2024, U.S. solar was large enough that a continental eclipse became a headline grid story. As summarised in the pv magazine USA Eclipse Livestream Article [6], EIA estimates put about 6.5 GW of capacity in the path of totality and 84.8 GW under partial eclipse. NREL’s modelled maximum PV reductions reached roughly 93% in Texas, 71% in the Eastern Interconnection, and 45% in the West — with ramp rates two to three times a typical dawn/dusk slope. Rebalancing leaned on hydro, gas, and a battery fleet that had grown from ~0.6 GW in 2017 to over 15 GW.
On the western side of that April 2024 total eclipse, the CAISO April 2024 Solar Eclipse Technical Bulletin [5] shows how a milder partial still bites a high-PV balancing area. Totality crossed Texas to Maine; California saw about 25–59% obscuration (northwest to southeast deserts), while the broader Western Energy Imbalance Market (WEIM) ranged from roughly 16% in northwest Washington to 89% in southeast New Mexico — less severe for California than October 2023, even though the fleet had grown further (about 18.5 GW grid-scale and 15.8 GW rooftop). Clear-sky modelling was again treated as the high-impact case — the same framing we use for the city curves below.
Under those assumptions, grid-scale output was expected to fall by about 6.3 GW from eclipse start to maximum (~−79 MW/min), then rebound by about 6.7 GW on the return (~+84 MW/min), never going to zero because the West was outside totality. Rooftop solar cuts were forecast to lift gross load by roughly 4.3 GW (~40%) near 11:00 a.m. Net load — load minus renewables — remained the operational stress: about +8.7 GW into the trough (average ~+115 MW/min, peaks near +198 MW/min) and about −11.3 GW on the recovery (average ~−150 MW/min), with the return ramp often the harder interval [5].
Across 2017, 2023, and 2024, the mitigation playbook stayed recognisable — and close to Europe’s 2015 approach in the ENTSO-E / SolarPower Europe Solar Eclipse Policy Brief [2]: accurate day-ahead solar forecasts that bake in eclipse geometry, special procedures to keep solar fleets on linear dispatch during the return, extra operating reserves, hydro and (increasingly) batteries for steep net-load ramps, and coordination across WEIM, RC West, distribution utilities, and neighbouring balancing areas [3][4][5]. Behind-the-meter rooftop solar must be reconstituted in load forecasts, not treated as invisible weather noise.
Why August 2026 is different. The 2015 European eclipse was a mid-morning event. The U.S. sequence from 2017 through 2024 shows the same physics under growing solar fleets — and even far from totality, the CAISO analyses [3][4][5] put net-load ramps of order 100–150 MW/min or more when fleets are large. On 12 August 2026 over Europe, peak obscuration arrives late in the day — closer to sunset in Spain — so the overlap with west-facing production is unusually important. Europe also enters 2026 with far more PV than in 2015, exactly the scale the ENTSO-E / SolarPower Europe Solar Eclipse Policy Brief [2] flagged as requiring deeper coordination than extra reserves alone.
City scan: 1 kW sites
We model a 1 kW fixed array at each city under clear-sky conditions (tilt roughly matching latitude). Eclipse-suppressed AC power is clear-sky output scaled by (1 − obscuration), using the nearest cell of the obscuration grid. Daily loss is the relative drop in energy over the local calendar day. Full per-city plots are collected in the Clearsky City Eclipse Report [9].
Summary numbers for south-facing arrays:
| City | Peak obsc. | Local peak | Clear energy (Wh) | Eclipse energy (Wh) | Daily loss |
|---|---|---|---|---|---|
| Madrid | 97.0% | 20:30 | 6101 | 6087 | 0.23% |
| Wales (Cardiff) | 93.0% | 19:15 | 5845 | 5811 | 0.58% |
| London | 91.0% | 19:15 | 5743 | 5719 | 0.42% |
| Paris | 91.0% | 20:15 | 6101 | 6089 | 0.20% |
| Frankfurt | 88.0% | 20:15 | 5675 | 5670 | 0.09% |
| Lisbon | 86.0% | 19:30 | 6157 | 6128 | 0.47% |
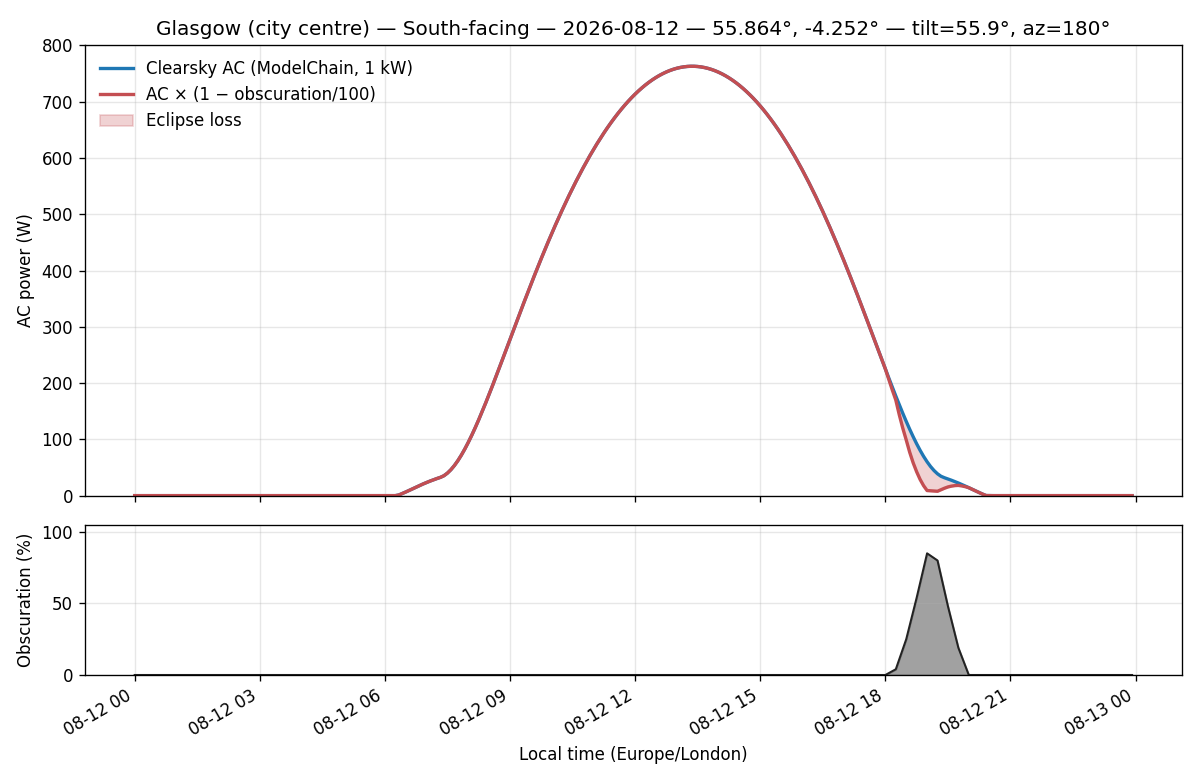
| Glasgow | 85.0% | 19:00 | 5688 | 5640 | 0.85% |
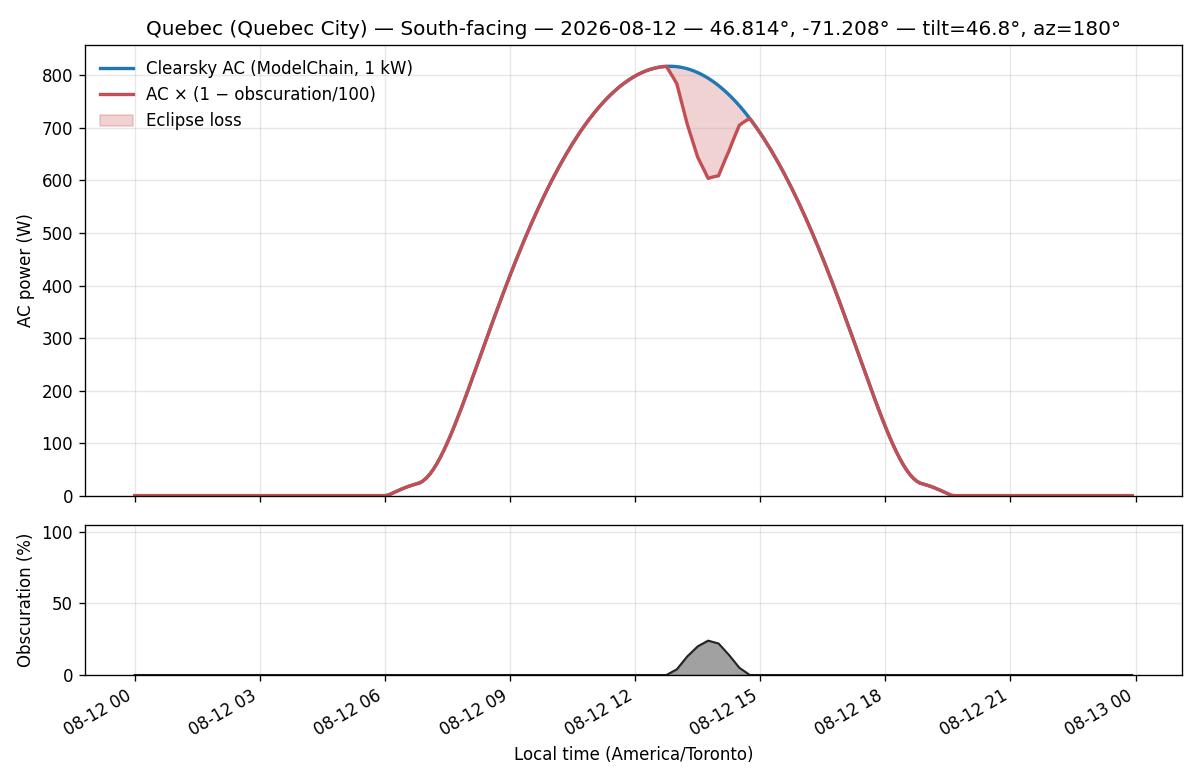
| Quebec City | 24.0% | 13:45 | 6112 | 5911 | 3.29% |
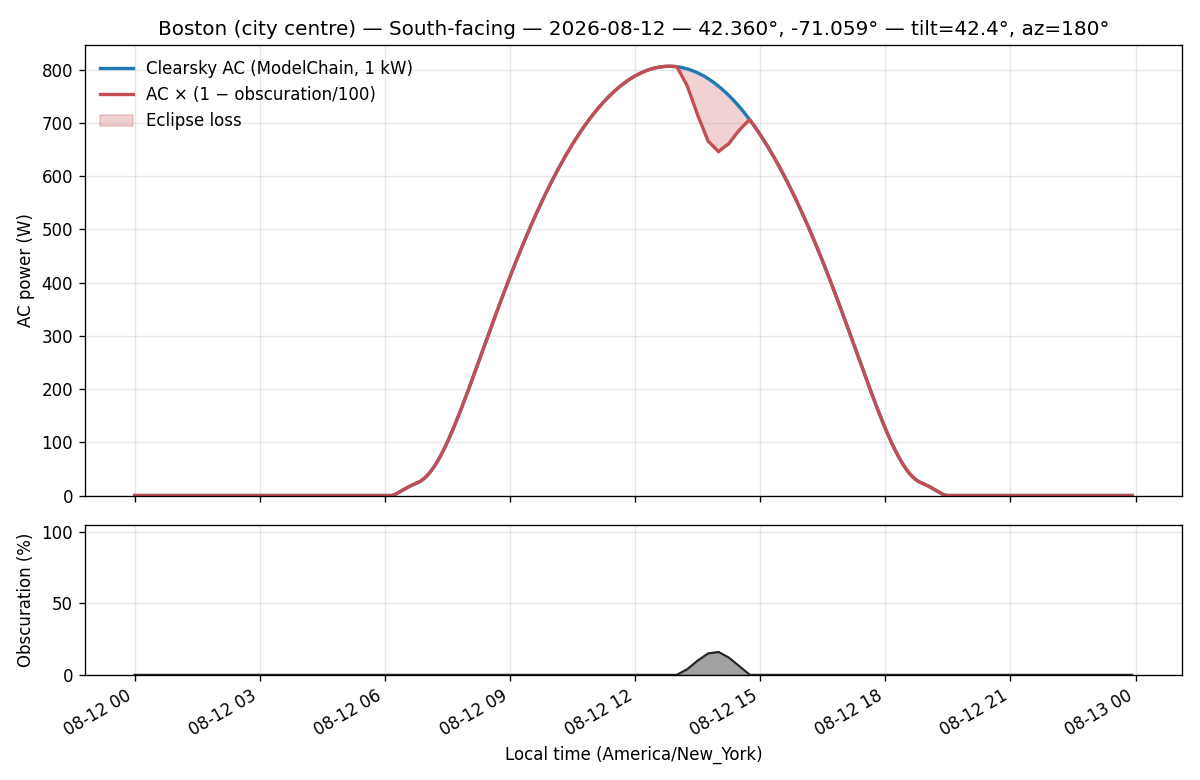
| Boston | 16.0% | 14:00 | 6004 | 5883 | 2.02% |
Near-totality in Spain — late and sharp
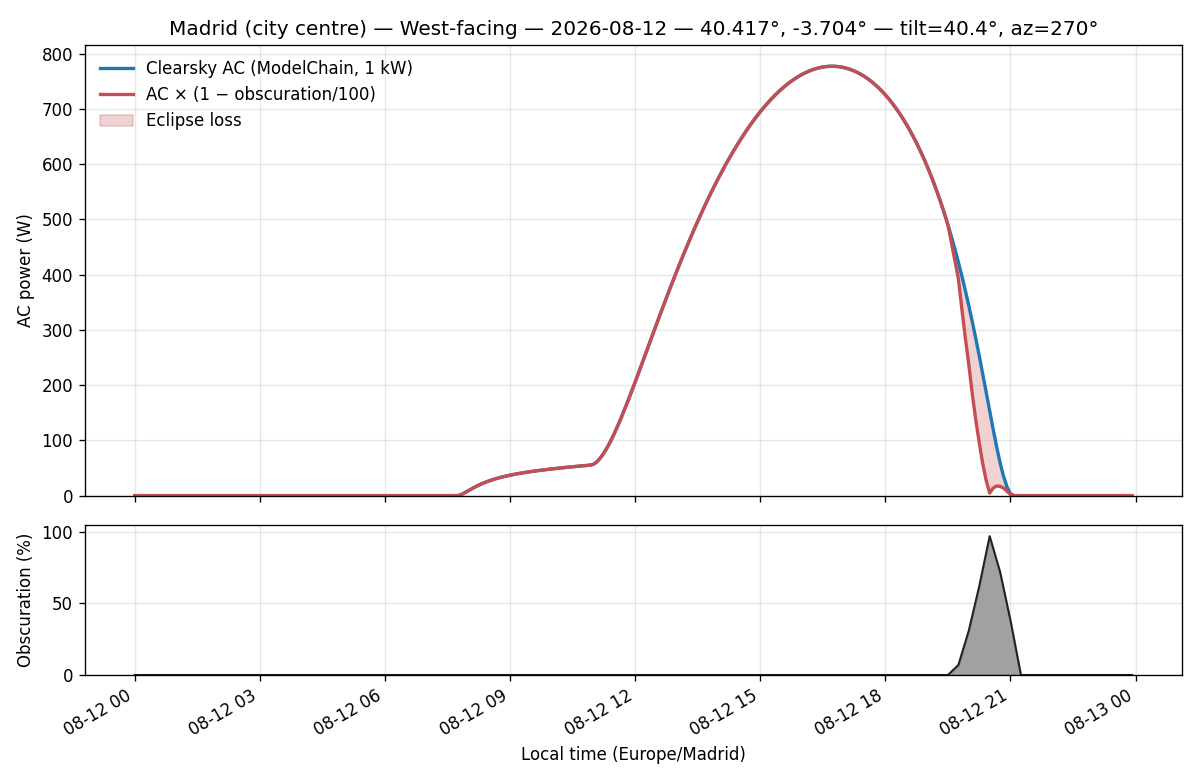
Madrid reaches ~97% obscuration around 20:30 local time. Instantaneous AC can fall almost to zero at peak, yet south-facing daily energy loss is only 0.23%: most of the day’s Wh were already harvested before the shadow arrived.
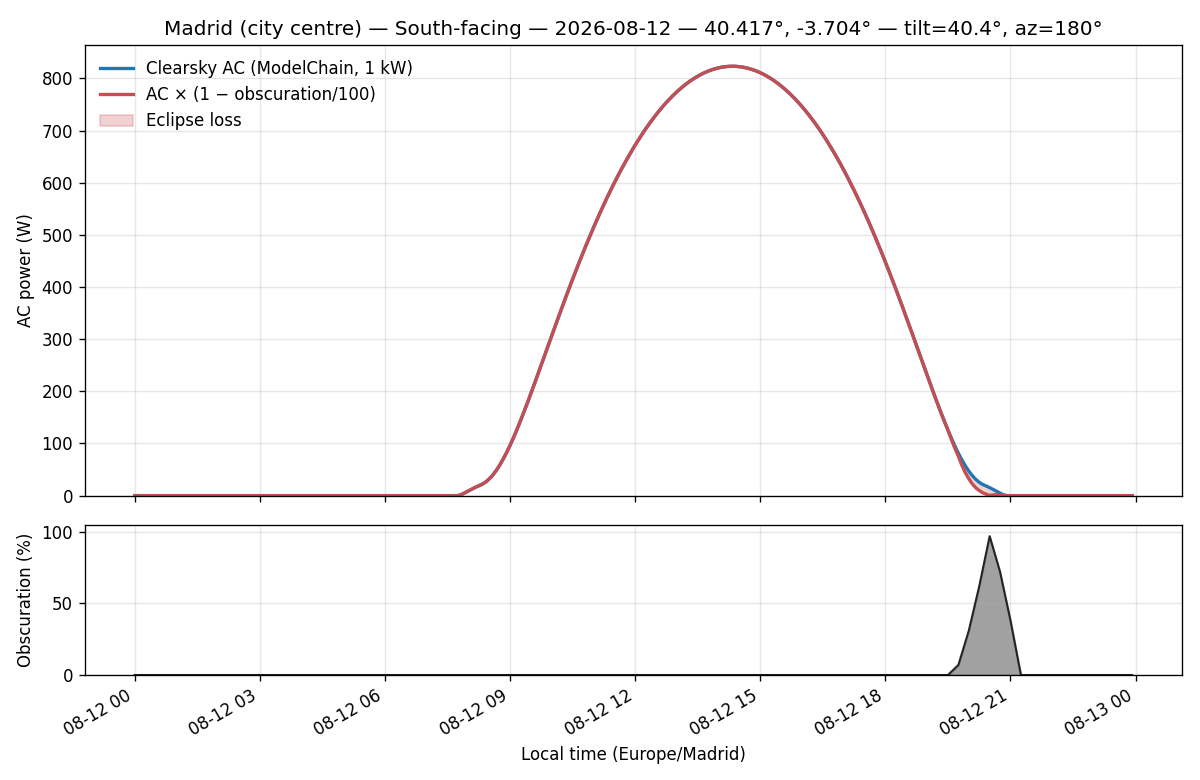 Madrid — south-facing 1 kW AC (clearsky vs eclipse-suppressed) and obscuration. [9]
 Atlantic Canada & New England — smaller eclipse, larger daily dent
Boston (~16% peak) and Quebec City (~24% peak) sit far from totality, but the partial eclipse lands near solar noon. Daily south-facing losses rise to about 2.0% and 3.3% respectively — larger than Madrid’s — illustrating why the ENTSO-E Solar Eclipse Impact Analysis [1], the pv magazine USA Eclipse Livestream Article [6], and the CAISO bulletins [3][4][5] all stress timing relative to the solar curve, not obscuration alone.
South vs west: orientation multiplies the risk
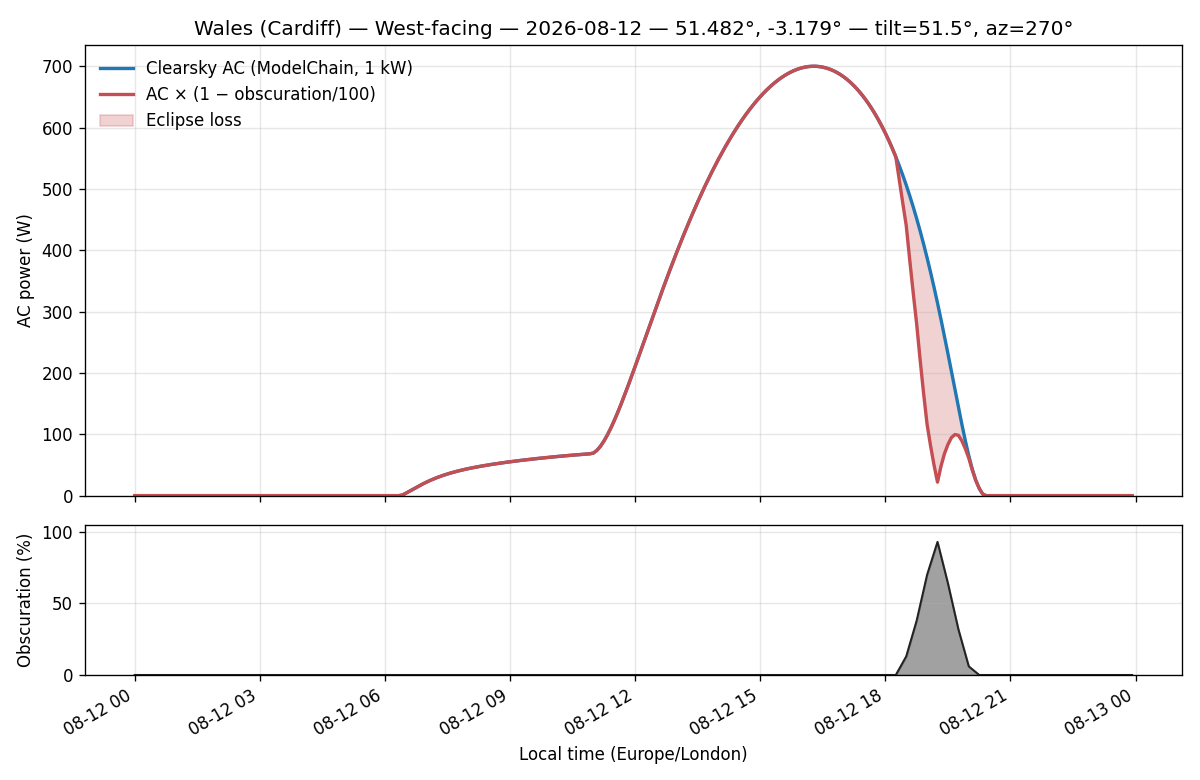
Roof and commercial fleets are rarely pure south. West-facing arrays (azimuth 270°) peak later in the day — precisely when Europe’s 2026 shadow is darkest. That west orientation is no longer unusual: as solar penetration has grown, utilities increasingly care about when power is delivered, not only how much. South-facing fleets cut midday net load but leave a steeper late-afternoon peak when people return home and air-conditioning, lighting, and appliances ramp up. Facing panels west shifts production toward those hours, which is why some jurisdictions have even offered incentives for west-facing installs, and why time-of-use rates that price afternoon electricity higher can make west arrays financially competitive for owners even when they yield slightly less annual energy overall. Roof geometry also forces the issue — many roofs simply face west, and that is the practical install. The SolarAnywhere West vs. South Article [7] sets out this case in detail.
The same 1 kW nameplate, same tilt, same obscuration series:
| City | South daily loss | West daily loss | West / south |
|---|---|---|---|
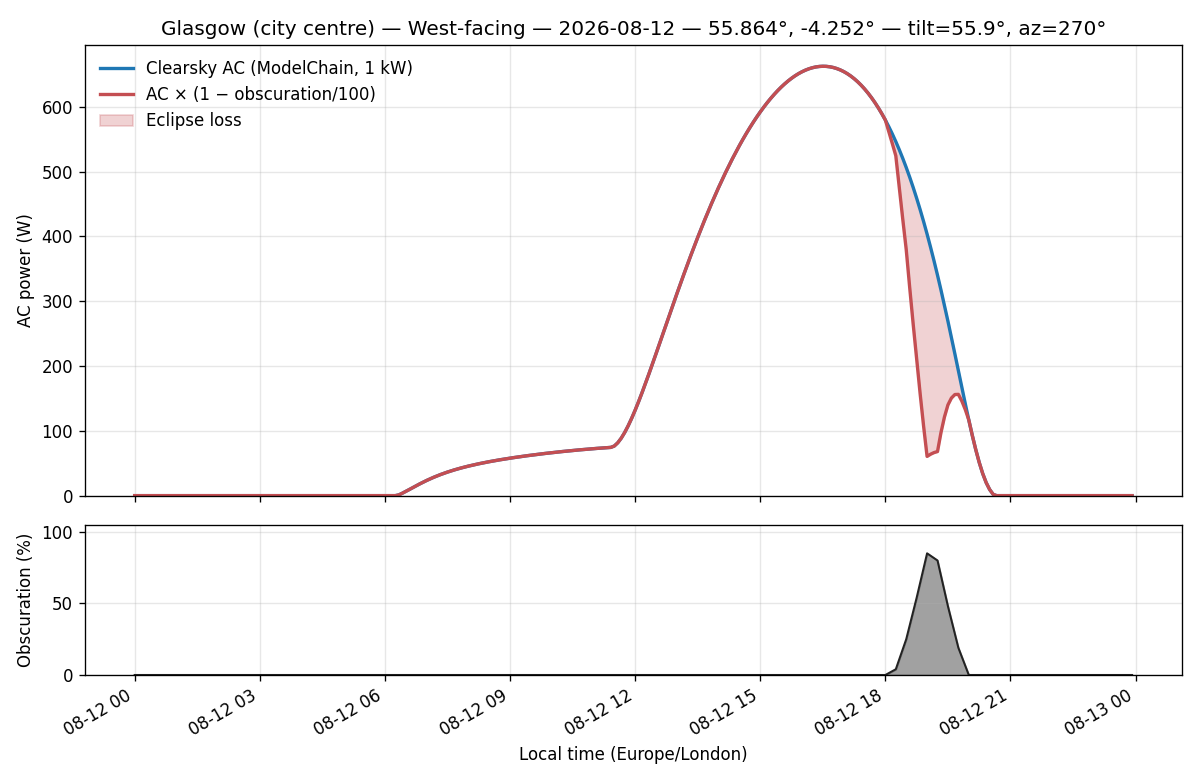
| Glasgow | 0.85% | 7.04% | ~8× |
| Wales (Cardiff) | 0.58% | 5.56% | ~10× |
| Lisbon | 0.47% | 4.16% | ~9× |
| London | 0.42% | 4.02% | ~10× |
| Paris | 0.20% | 3.44% | ~17× |
| Madrid | 0.23% | 2.33% | ~10× |
| Frankfurt | 0.09% | 0.89% | ~10× |
| Quebec City | 3.29% | 3.31% | ~1× |
| Boston | 2.02% | 2.16% | ~1× |
For Glasgow, peak obscuration is identical (85% at 19:00 local); daily loss jumps from 0.85% to 7.0% when the array faces west.
Takeaways for 12 August 2026
- Obscuration is not daily loss. Madrid’s ~97% peak barely dents south-facing daily Wh; Quebec’s 24% midday partial cuts more energy over the day [9].
- Orientation matters more in Europe this time. Late-day totality lines up with west-facing production [7][9]. Fleet models that assume all-south arrays will understate energy and ramp impacts where west roofs are common.
- Ramps still dominate operations. As in the ENTSO-E Solar Eclipse Impact Analysis [1], the ENTSO-E / SolarPower Europe Solar Eclipse Policy Brief [2], the CAISO August 2017 Solar Eclipse Report [3], the CAISO October 2023 Solar Eclipse Technical Bulletin [4], the CAISO April 2024 Solar Eclipse Technical Bulletin [5], and the pv magazine USA Eclipse Livestream Article [6], the operational stress is the gradient — not only the depth of the trough. Scale 1 kW city curves by regional installed capacity (and cloud uncertainty) to size reserves; plan for observability, coordination, and flexible resources, not reserves alone.
- Use the map and city numbers together. Geography sets obscuration timing [8]; orientation and local solar geometry set how much energy and how fast power moves [9].
Method note: results assume clear skies. Clouds, curtailment, and inverter clipping are not modelled. Figures are illustrative for a single 1 kW plant, not a regional fleet forecast.
References
[1] ENTSO-E, ENTSO-E Solar Eclipse Impact Analysis (Solar Eclipse 2015 — Impact Analysis), 19 Feb 2015. PDF
[2] ENTSO-E / SolarPower Europe, ENTSO-E / SolarPower Europe Solar Eclipse Policy Brief (Solar Eclipse March 2015: The Successful Stress Test of Europe’s Power Grid – More Ahead), 15 Jul 2015. PDF
[3] California ISO, CAISO August 2017 Solar Eclipse Report (CAISO Analysis of the August 21, 2017 Solar Eclipse), 1 May 2017. PDF
[4] California ISO, CAISO October 2023 Solar Eclipse Technical Bulletin (October 14, 2023 Solar Eclipse Technical Bulletin), 5 Sep 2023. PDF
[5] California ISO, CAISO April 2024 Solar Eclipse Technical Bulletin (April 8, 2024 Solar Eclipse Technical Bulletin), 11 Mar 2024. PDF
[6] Anne Fischer, pv magazine USA Eclipse Livestream Article (“Livestream shows how eclipse impacts solar power production across the U.S.”), pv magazine USA, 8 Apr 2024. Article
[7] Adam Kankiewicz, SolarAnywhere West vs. South Article (“West vs. south: Why change the orientation of your solar PV system”), SolarAnywhere / Solar Today, 2015. Article
[8] Global Obscuration Animation for 12 August 2026. Interactive map
[9] Clearsky City Eclipse Report for 12 August 2026 (city plots and detailed site report). Report